TRULY INTELLIGENT ACCOUNTING INTELLIGENCE SOFTWARE
Insights
Keep an AI-assisted finger on the pulse of your practice.
-
 Ask in plain English with natural language search—“Which clients are overdue?” gets you real answers, fast
-
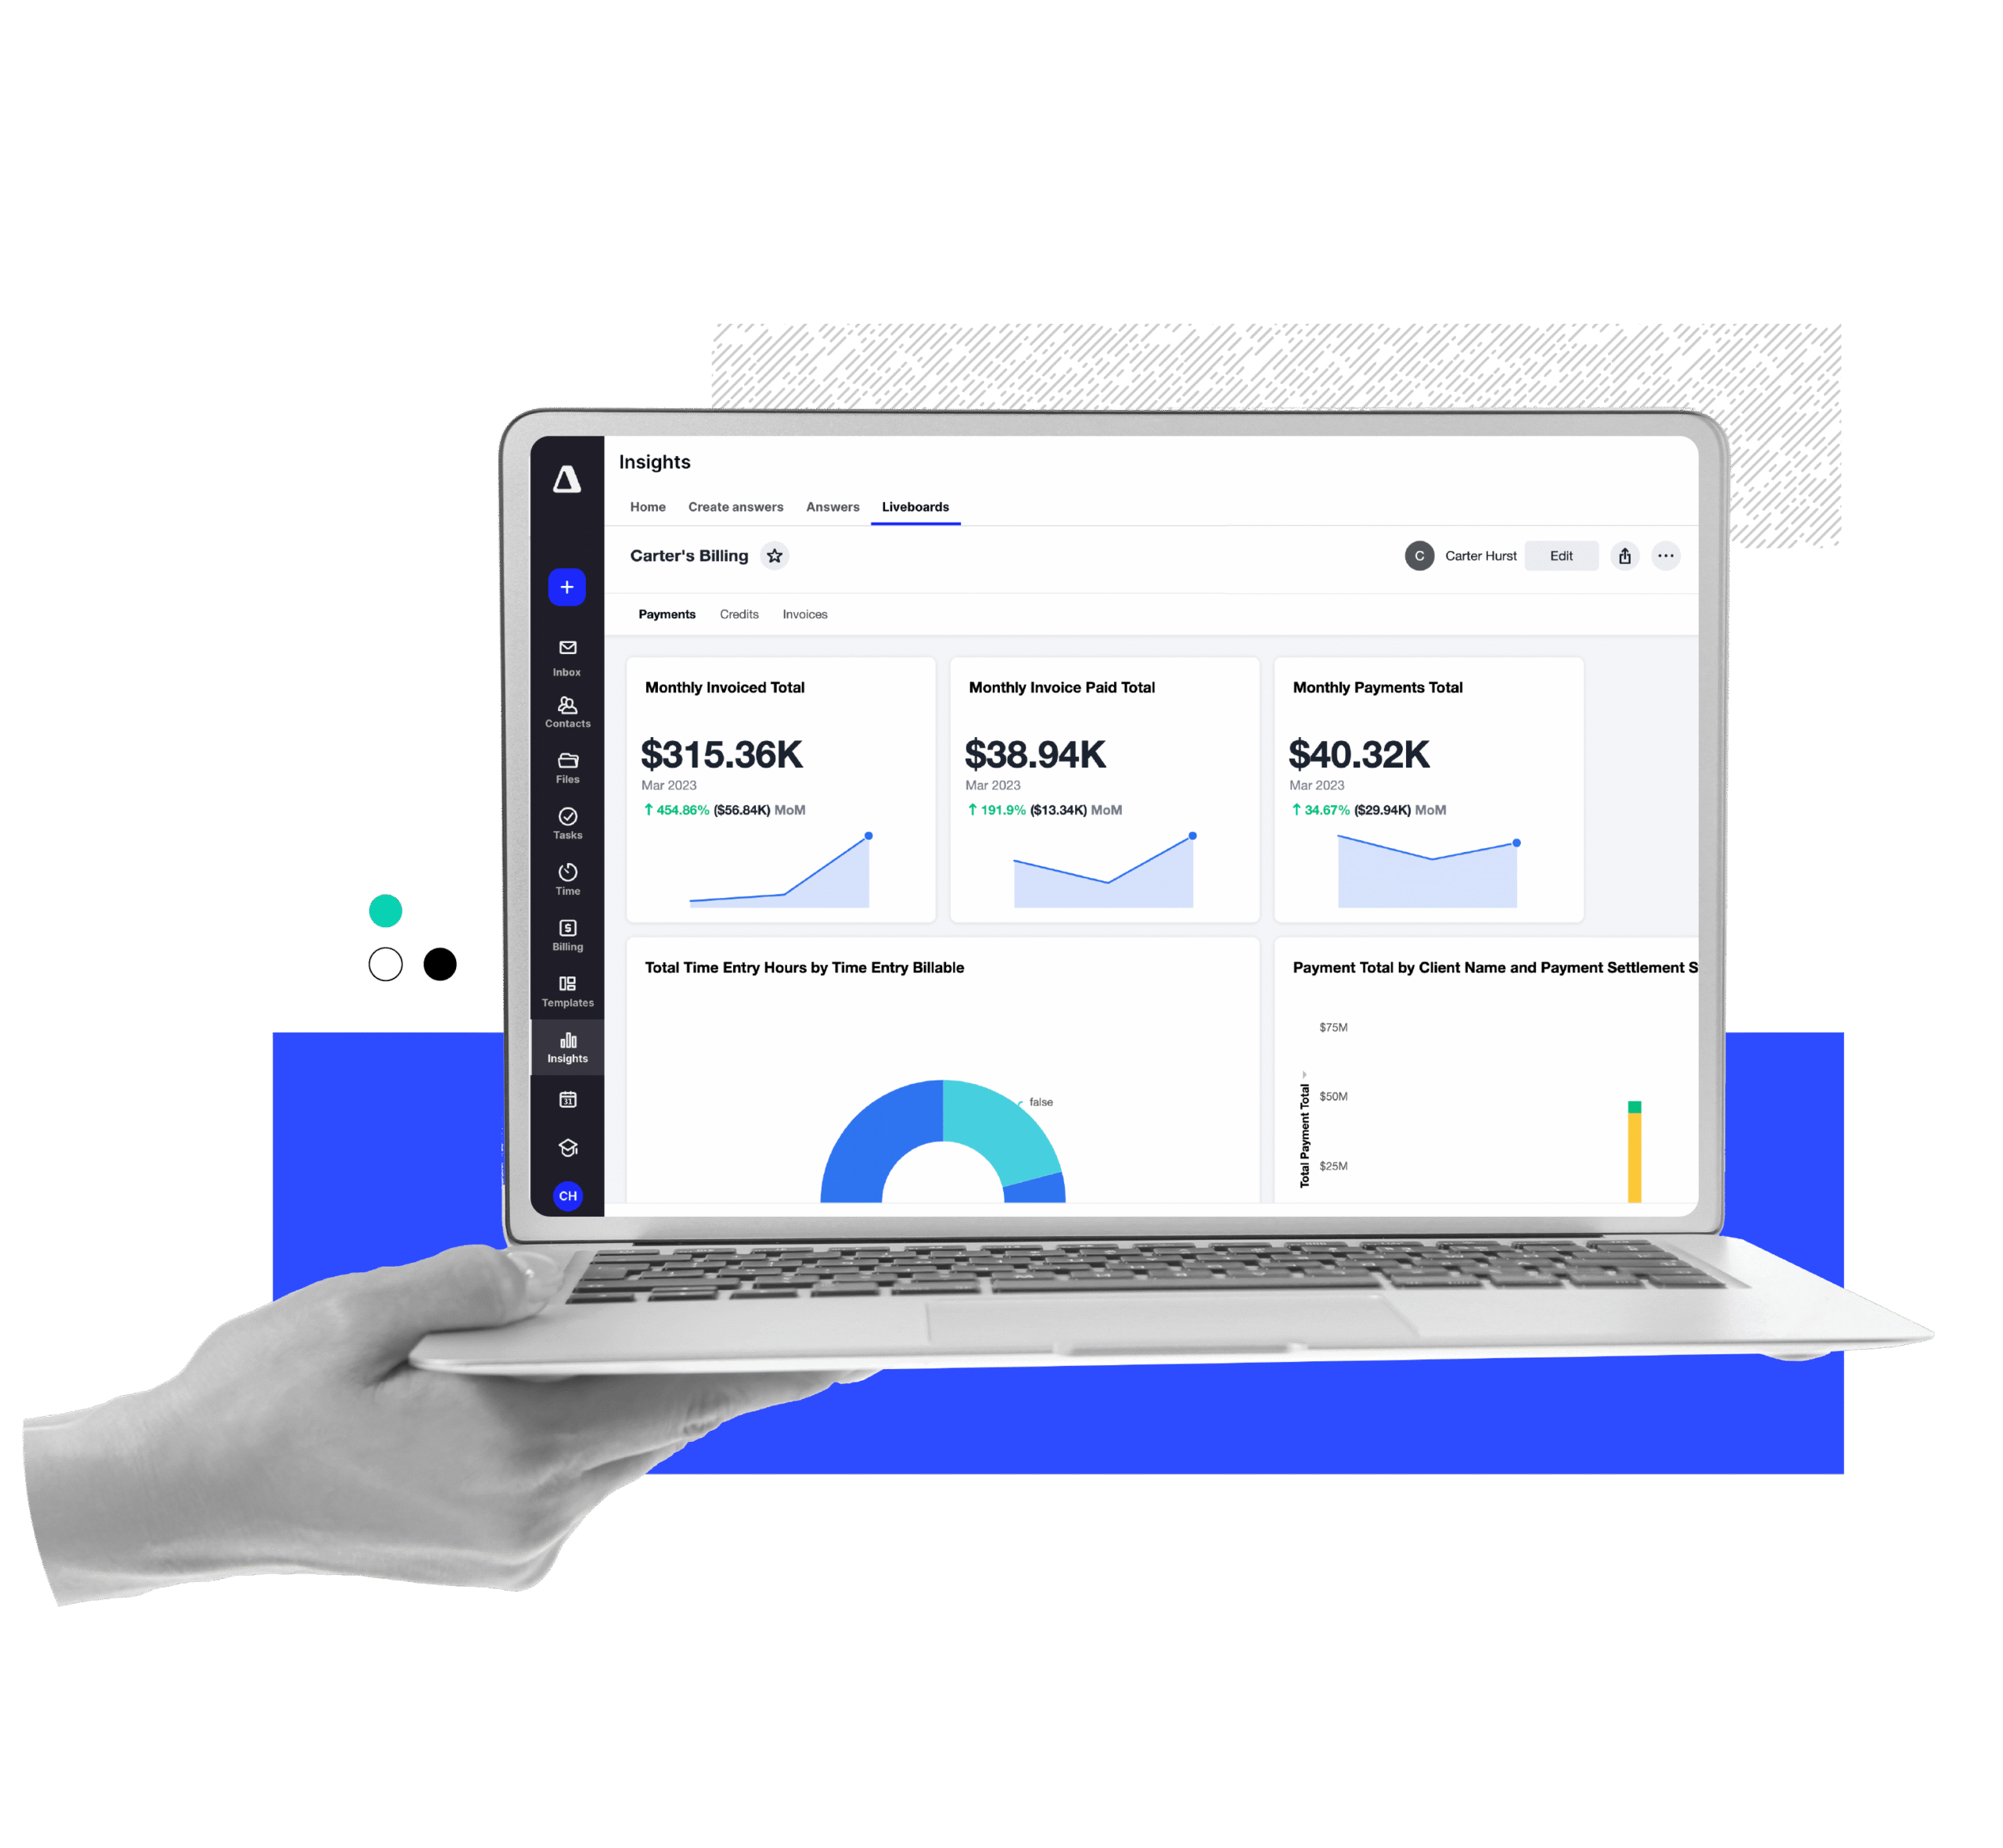
Track key metrics across billing, time, tasks, and client activity in live dashboards
-
Schedule pre-built reports to be delivered to key stakeholders
-
Set alerts when KPIs dip below or rise above thresholds
-
Canopy Coworker transforms data into real-time, actionable dashboards that visualize team capacity, project health, and firm-wide profitability
“You've got to have the insights. That's where you can see what's being done, who's doing it. That’s where the money’s at.”Shelly Lingor, CEO, Financial Solution Advisors
Data-driven decisions get you there faster.
Fine-tune your firm operations.
Accelerate Speed to Insights
With your data and data analysis tools under the same roof, you can know exactly what’s going on with your firm at any time. At last, the truth about your practice.
Uncover Unknowns
With progress billing and real-time WIP tracking, you can monitor realization rates mid-project to identify inefficiencies before they impact your bottom line.
Democratize Data
It’s hard to argue with data. When you arm your firm with the ability to access data, you open up the floodgates for innovation and problem solving. It’s like Gutenberg’s printing press, just with data access!

“Before Canopy, getting financial reports was a month-long manual process. Now, with Canopy’s insights, we can pull real-time reports and address issues within a day.”

“Canopy Insights allows us to be much more proactive with [clients], instead of waiting until the last minute and being more reactive.”
Analyzing Your Firm Data
There’s a better way than rows and columns. (No offense, rows and columns. We love you!)

Answers
Quickly visualize your data. It’s as easy as identifying your data points and hitting Enter. Your data will display in a recommended visualization style that you can then change or refine to help you find the answer to your data question.

Filters
Get the most out of your data and visualizations with filters that can show what’s most important to you and your firm. Create a filter for each employee, role, assignment, services, month, location, etc.

Drill Down
Discover even deeper insights by starting with an Answer. Click directly on the visualization and select the data point to refine your search for answers.

Custom Formulas
To get richer insights, you can add a formula to your search. Perform mathematical functions, check for and replace null values, or add IF-THEN-ELSE logic. (Just like your favorite tool that rhymes with shmexcel.)

Search
Use search to answer questions about your data without having to consult a data analyst. Really. Simply type in your inquiry—1040 clients with open tasks, for instance—and watch all of your data dreams come true. Or most of them, at least.

Scheduling Reports
Automatically keep stakeholders informed on firm initiatives. Emailed reports will include either a CSV or PDF of the Liveboard visualizations being shared.

Download/Export
Whether you access the raw data directly in the product or via download, you’ll always be able to see and access your data. It’s your data, after all.

Present & Share
Turn your Liveboards into presentations in a matter of seconds. Each visualization gets its own slide so that everyone can easily see. If anyone has a question mid-presentation, you’re still presenting live data! You can drill down and interact with it to help guide the discussion to where it will benefit your firm most.

Alerts
Monitor changes in Key Performance Indicators (KPIs) with scheduled alerts. Receive notifications for your KPIs at your preferred cadence—on an hourly, daily, weekly, or monthly basis. Create thresholds and indicate whether you want to be notified if it increases, decreases, or changes by a certain percentage. We said “finger on the pulse of your practice” and we meant it.
Dashboards & Visualizations
Because why settle for just one measly visualization?

Liveboards
When was the last time you only had one question about your data? Never. One leads to many. And you don’t just want to see it once, you want to reference it whenever it strikes your fancy. With Liveboards, you can keep a collection of Answers that update in real time. Use tabs and custom tags to further organize your data.

Visualization Formatting
Data visualizations come in many shapes and sizes: graphs, charts, pivot tables, maps, and more. We’ll recommend a format when you first create your answer. As you build Liveboards and drill down, though, you may find you want to display your data in different ways. With Canopy, we make sure you can.
Billing Liveboard
See revenue billed by the firm and break it down by client, service, and team member. Better yet, see how you perform year over year.

Service Item Analysis
See just what the firm is charging per service based on hours billed or billed amounts, because write ups and write downs happen. Though you may have an established rate, seeing the actual rate broken down by service and team member can be quite informative, to say the least.

Team Member Production Analysis
Check on team member production including realization, adjustments, and average billed rate, giving you better insight on how best to assign your team members and coach them.

Billing Realization & Client Profitability
Always know where you stand with each client, employee, and service item. This report makes it easy to see at a glance just where you’re below realization. No sifting and analyzing. Jump straight to solving problem areas and let what’s going right go undisturbed.
What are the benefits of a business intelligence tool for my accounting firm?
Your data becomes your advantage with live visual dashboards. Canopy’s Insights module allows you to:
-
Monitor firm performance in real time
-
Set alerts on KPIs like billed revenue or open tasks
-
Automate reports for stakeholders
-
Analyze team productivity, client profitability, and service line trends
-
Use AI-powered natural language search to ask data questions like: “Which clients have overdue tasks this week?”
“Overall, my firm's experience with Canopy has been amazing. The platform is user-friendly, customizable, and offers a wide range of automation options that have helped me save a lot of time. The reporting features provide valuable insights that have helped me improve my sales performance and make better business decisions. I would definitely recommend Canopy Software to other businesses looking for a do-it-all CRM solution.”Jermill G.
Ready to get started?
Frequently Asked Questions
Can’t find the answer you are looking for? Reach out to our support team.
Anyone can drill down into an answer. In order to resize, move or create a net new Answer or Liveboard, you will need to purchase Pro.