
What’s new:
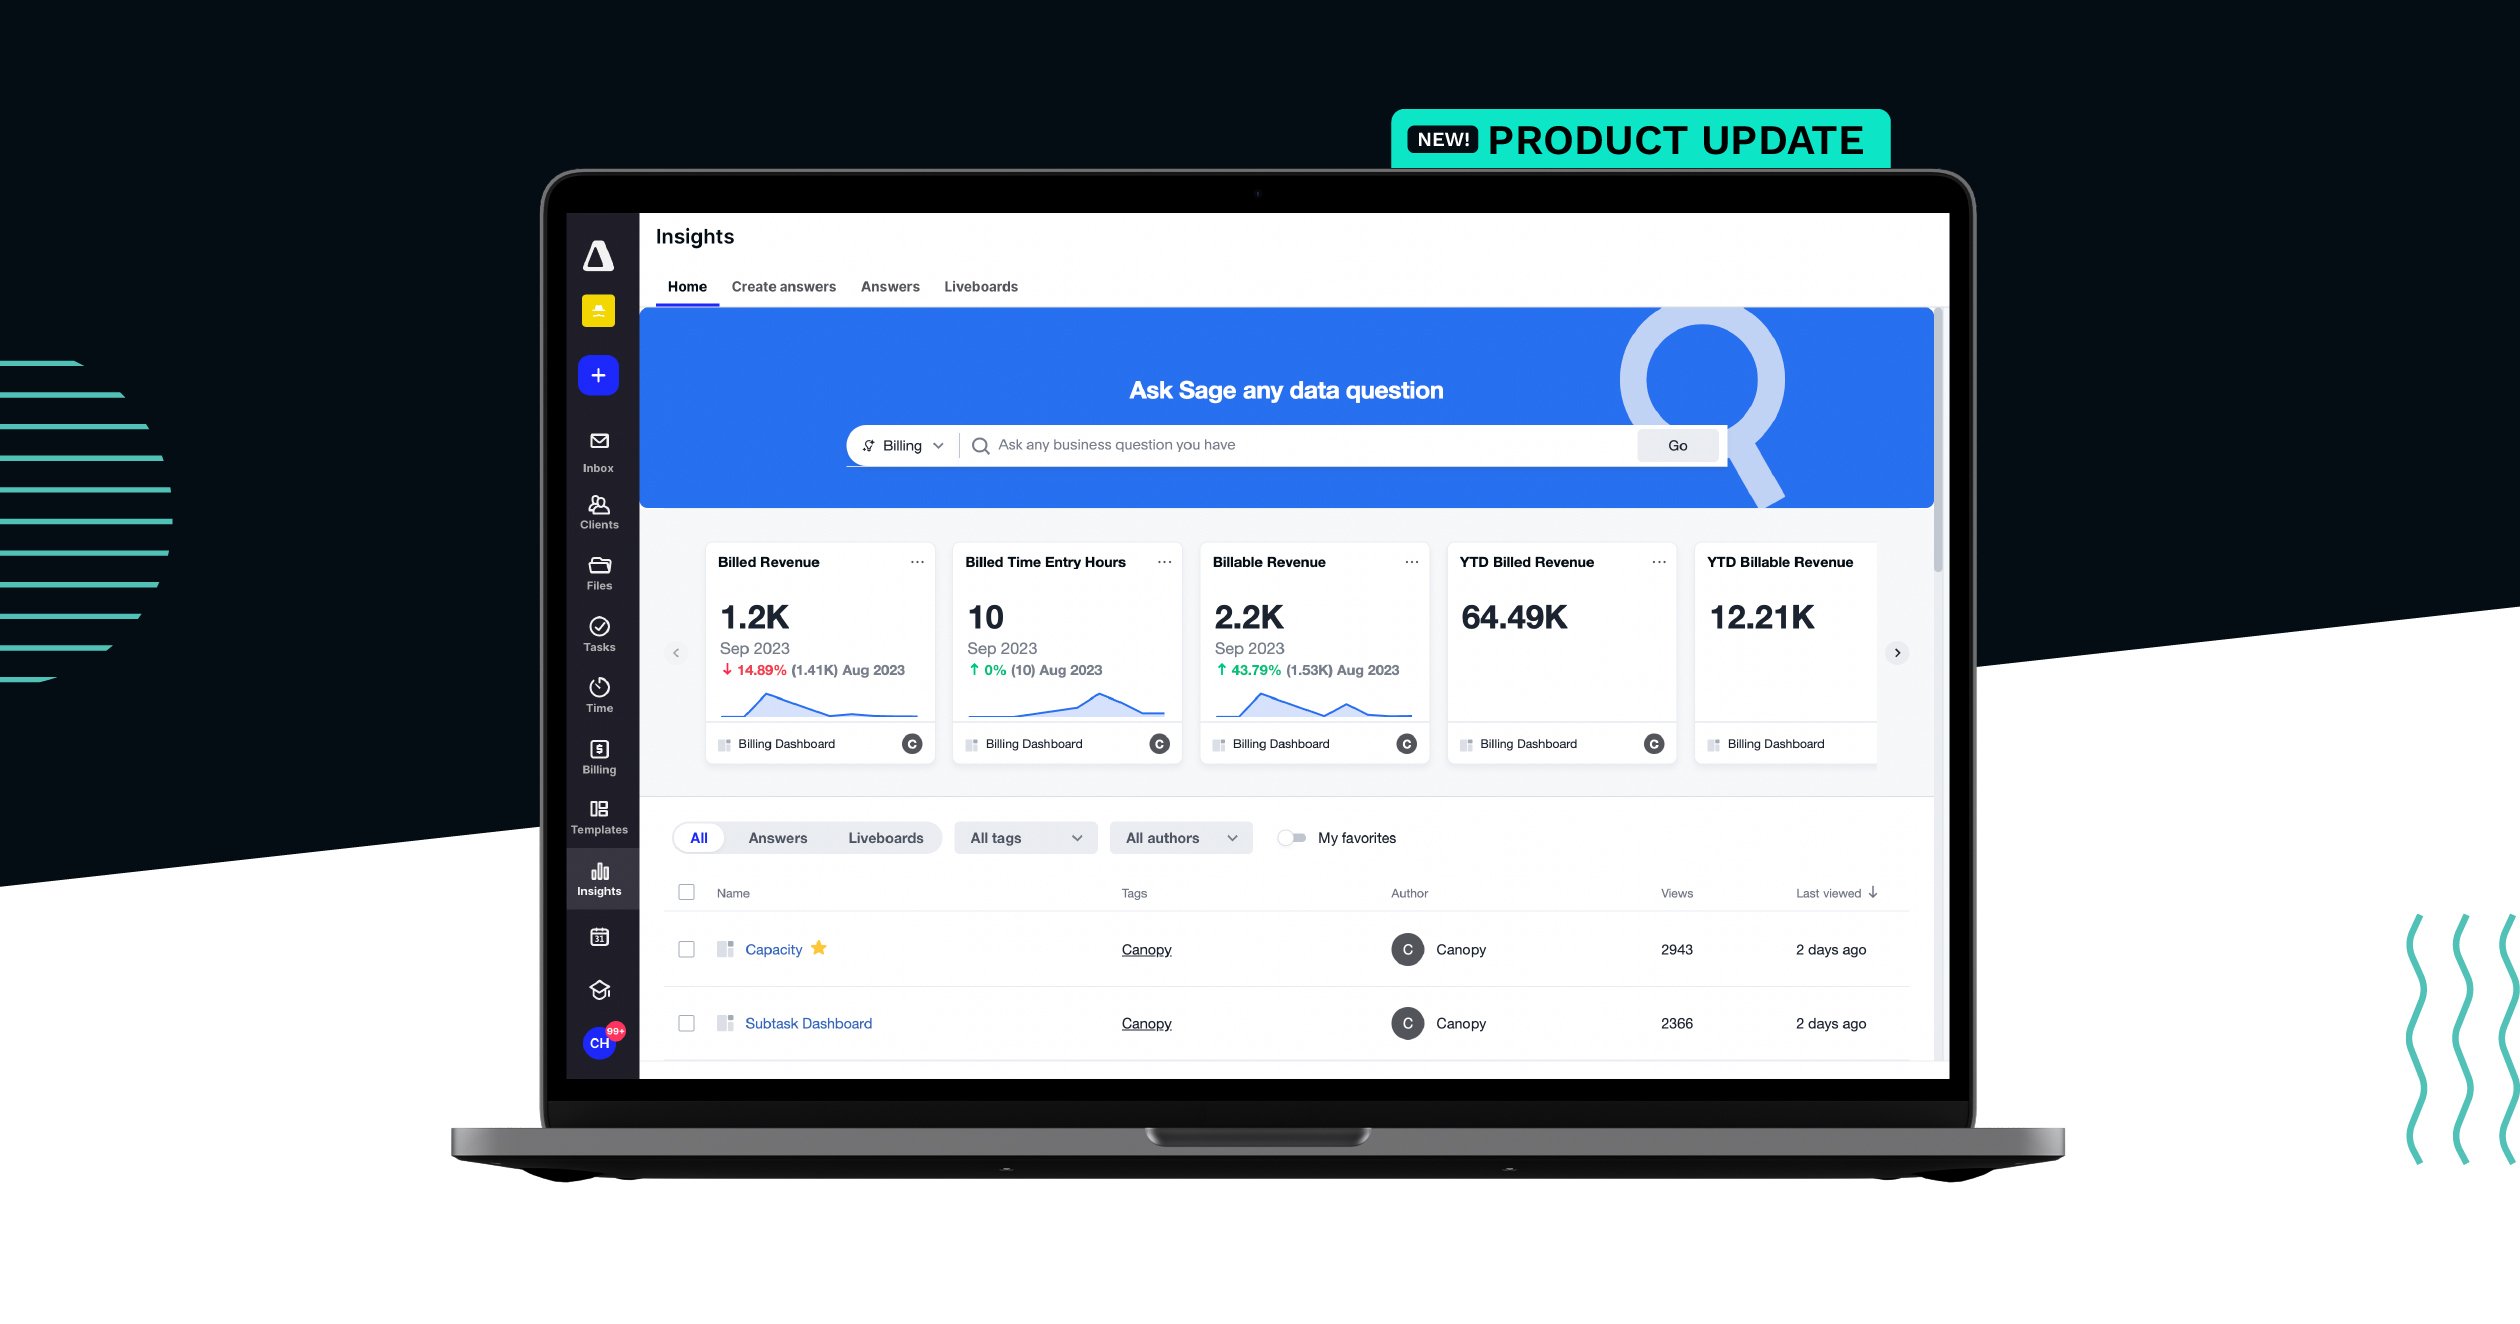
Within our custom reporting and dashboard tool (Insights), users can utilize natural language processing to create visualizations.
Why it matters:
Knowing exactly what data points to use, how to best relate 2 or more data points, and then throwing in custom formulas requires a level of expertise that not everyone at your firm may have. Plus, it takes time.
Natural Language Processing is AI that interprets a statement or question you provide that then identifies data points to best answer your question. The tool will take those data points and create a visualization. You can then provide feedback when the tool produces something you like or don’t like so that it can get better at answering your questions.
Where to find it: (what module it’s in)
Canopy Pro for any Canopy module. The more modules you have, the more data points you’ll be able to utilize.